AP MECHANICS -C LEARNING OBJECTIVE CON 1.C -Describe the force within a system and the potential energy of a system.
In the last section, we derived a relationship between force F(x) and potential energy U(x). In order to use the relationship, we will need to know the exact function of either U(x) or F(x) and then use calculus to obtain the other.
In this section, we will take a visual approach. Suppose we are provided with a U(x) curve in a graphical format, can we then infer F(x)? The answer is yes. We can use the following rules to infer the shape of the F(x) curve from the U(x) curve. Here are the rules:
- When the slope of the U(x) curve is zero the F(x) will be zero. In order words when the U(x), curve becomes parallel to the x-axis, F(x) will be zero.
- When the slope of the U(x) curve is positive the force will be negative. Refer to the negative sign between F(x) and U(x) relationship.
- Similarly, when the slope of the U(x) curve is negative the force will be positive.
That’s it. If you follow the above three rules, you will be able to correctly draw the F(x) curve from the U(x) curve. Let me show it in action with a following examples.

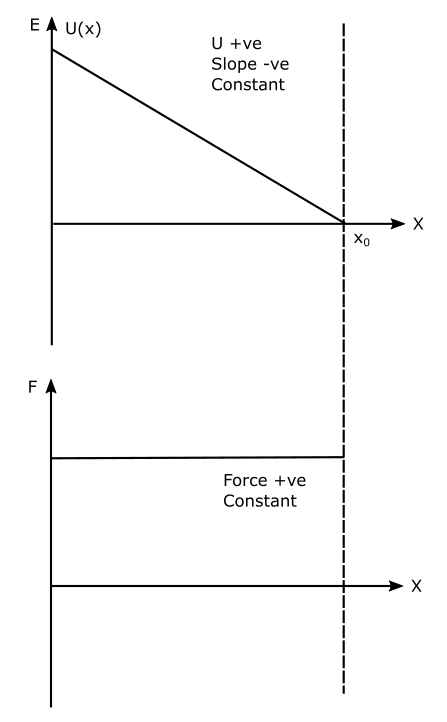
Refer to Figure , a hypothetical U(x) curve, which is declining. Hence the slope of the curve is negative and constant. This means the force curve F(x) will be positive and constant.

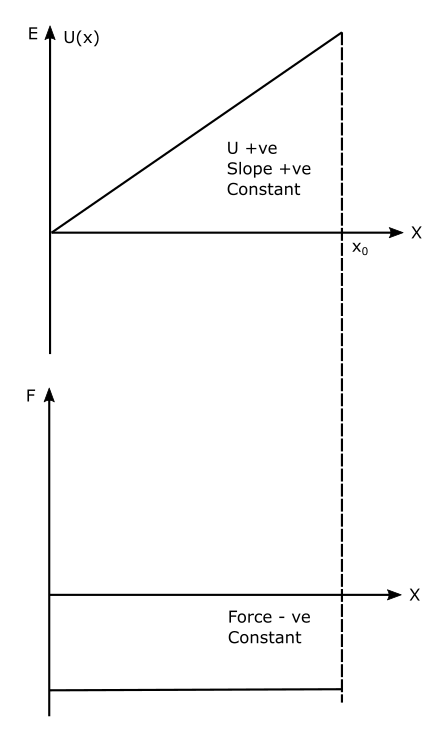
Refer to Figure, a hypothetical U(x) curve, which is increasing. Hence the slope of the curve is positive and constant. This means the force curve F(x) will be negative and constant. Please note that we are not interested in the exact magnitude of the force but only the rough shape. The exact magnitude can be determined if U(x) is known, then we can use differentiation to arrive at the exact magnitude.
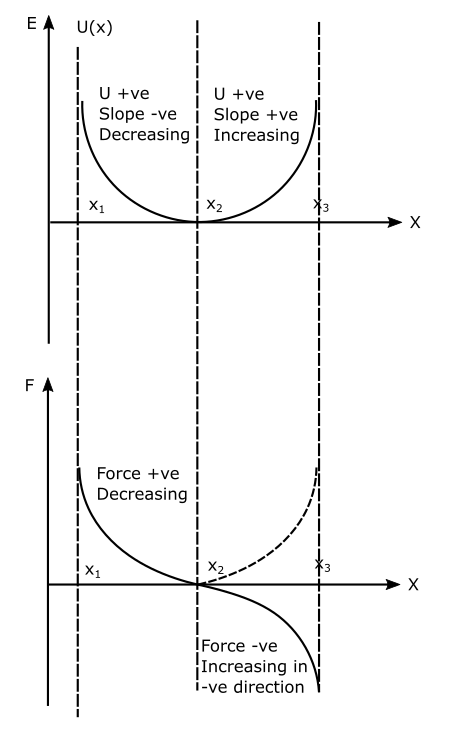
Let’s now consider a more complex U(x) curve. Refer to Figure below and proceed systematically and use the rules.

First, let’s find values of x, where the slope of the U(x) curve is zero. Clearly, in this curve, there is only one such point $x_2$. Hence we draw a dashed line parallel to the Y axis. This line will pass through $x_2$ on the x-axis of the F(x) curve. As per the rule, force at this point will be zero. In other words, the F(x) curve will cross the x-axis at $x_2$. Let’s switch our focus to the left of point $x_2$. Between $x_1$ and $x_2$ the slope of the U(x) curve is negative. Which means that the force will be positive in this zone. The value of U is decreasing in this zone hence the value of F will also decrease. As the slope changes its value from point to point from $x_1$ to $x_2$ with decreasing rate the appropriate curve will be curvilinear as shown in the figure. Now, let’s focus on the right side of point $x_2$. From $x_2$ to $x_3$ the slope of the U(x) curve is positive. Hence the force will take negative values in this zone. You can now observe the symmetrical nature of the U(x) curve, hence the F(x) will also follow the similar curvature between $x_1$ and $x_2$, but with a negative sign, the mirror image. Hence first draw a symmetrical curve from $x_2$ and $x_3$ (shown with a dashed line), then simply take the mirror image of it considering the x-axis as a mirror.
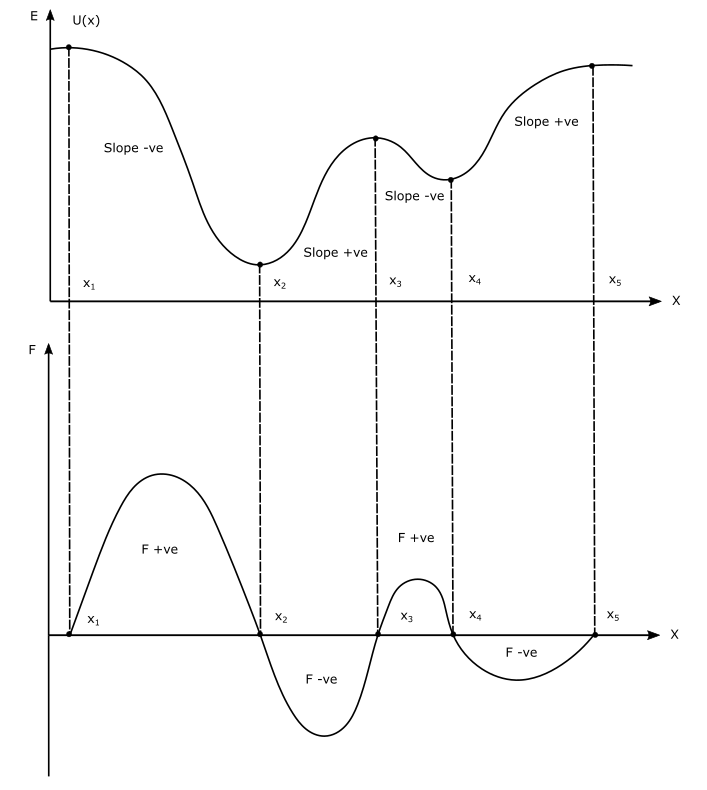
Let’s now take a more complex example and apply the rules to derive the force curve from the potential curve.

Now, let’s look at the curve between $x_1$ and $x_2$, you will see that the slope is negative. Hence in the zone $x_1$ to $x_2$ the force will take positive values. But the force curve is expected to cross the x-axis at both $x_1$ and $x_2$, hence it will first increase and then decrease to meet the x-axis at $x-2$. First, the U(x) declines gradually then at a higher rate then at a gradual rate again. The approximate shape of the force curve is shown in the figure.
Now, let’s look at the curve between $x_2$ and $x_3$, you will see that the slope is positive. Hence in the zone $x_2$ to $x_3$ the force will take negative values. But the force curve is expected to cross the x-axis at both $x_2$ and $x_3$, hence it will first decrease and then increase to meet the x-axis at $x-3$. First, the U(x) increases gradually then at a higher rate then at a gradual rate again. This time though the magnitude of change in U is smaller compared with the last time. Hence the force curve will take smaller values as well. The approximate shape of the curve force is shown in the figure.
Now, let’s look at the curve between $x_3$ and $x_4$, you will see that the slope is negative. Hence in the zone $x_3$ to $x_4$ the force will take positive values. But the force curve is expected to cross the x-axis at both $x_3$ and $x_4$, hence it will first increase and then decrease to meet the x-axis at $x-4$. First, the U(x) declines gradually then at a higher rate then at a gradual rate again. The approximate shape of the force curve is shown in the figure. Clearly, the net change in U is also smaller compared with the last two cases hence the force curve also reflects the same.
Finally, let’s look at the curve between $x_4$ and $x_5$, you will see that the slope is positive. Hence in the zone $x_4$ to $x_5$ the force will take negative values. But the force curve is expected to cross the x-axis at both $x_4$ and $x_5$, hence it will first decrease and then increase to meet the x-axis at $x-5$. First, the U(x) increases gradually then at a higher rate then at a gradual rate again. This time though the magnitude of change in U is smaller compared with the last time. Hence the force curve will take smaller values as well. Further, the rate of change of U compared with other segments seems small, as the curve U(x) curve between $x_4$ and $x_5$ is more stretched or flat. Hence the force curve is also flatter compared with previous cases. The approximate shape of the curve force is shown in the figure.
The above methodology can be applied in any kind of complex situation to arrive at the force curve from the given potential energy curve and is a very handy method to roughly determine the nature of forces in action.